One of the challenges of introducing new metrics to measure the scholarly impact of journal articles is that we want these metrics to be consistent and reproducible. This task ranges from easy (single authoritative source), hard (mediated by middlemen), and very hard (multiple sources). Twitter falls in the last group – there is no single, defined set of tweets about a paper as Twitter itself doesn’t make old tweets available. But there are multiple ways to get around the problem using a plethora of online services (e.g., multiple Twitter APIs, Topsy, private, in-house applications, etc.). The second category is common amongst ALM providers, including PLOS: we collect citations, bookmarks, etc. from CrossRef, Web of Science, Mendeley, etc. and then display these numbers next to our journal articles.

Apples & Oranges – They don’t Compare. Flickr photo from thebusybrain.
Scott Chamberlain from the rOpenSci project has shed light on this problem, analyzing ALM data harvested by each of the following four metrics providers:
(rOpenSci is a larger project to provide wrappers for all science APIs for the R statistical programming environment. This includes packages that talk to the metrics providers listed above.)
He compared the following metrics for a single set of 565 papers published by PLOS:
- Scopus
- PLOS usage stats
- PubMed Central usage stats
- Mendeley
- CiteULike
Scott found that most metrics are similar between providers, but the consistency could be better overall:
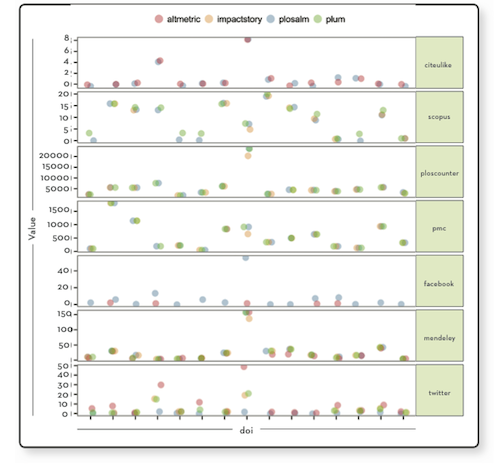
A comparison of 7 different metrics from Altmetric.com, ImpactStory and PLOS on a set of 20 PLOS DOIs. Fig. 3 from http://dx.doi.org/10.3789/isqv25no2.2013.02.
He identified two reasons for these inconsistencies: different collection dates and different methods of data collection (most prominently for Twitter). To address the disparity, the refresh date specifying the last update is critical and should also be accompanied by a link to the original data source (ex: Scopus or Mendeley page showing citation counts or bookmarks). At the moment, most article-level metrics providers, including PLOS, do provide this information when possible (ex: CrossRef, Facebook, etc. do not have a reference page for each article) .
Read the full set of findings for more insights on the work ahead for this maturing set of metrics, published in Information Standards Quarterly last week: Consuming article-level metrics: observations and lessons from comparing aggregator provider data. The source code for his analysis is available on Github, and he has written ablog post.
We as the data providers have to become better in providing consistent numbers across providers and, when there’s variance, explain the difference. The ALM Workshop 2013 should provide that venue as we raise these issues together with the community-at-large and collectively identify practices that represent good data stewardship.
Otherwise, we run the risk that all the consumers (of these data) lose their appetite for these fresh new fruits and return to old, boring fare that only comes in a single citation flavor and is already dried up (i.e., at least two years old).

Have been drying apples today. Flickr photo from tusnelda.
8/9/13: Updated post to include to blog post by Scott Chamberlain.
References
Chamberlain, S. (2013). Consuming Article-Level Metrics: Observations and Lessons. Information Standards Quarterly, 25(2), 4. National Information Standards Organization. doi:10.3789/isqv25no2.2013.02
blog comments powered by Disqus